1. (Test1/Q 33/Calculator)
| Number of Portable Media Players Sold Worldwide Each Year from 2006 to 2011
According to the line graph above, the number of portable media players sold in 2008 is what fraction of the number sold in 2011 ?
|
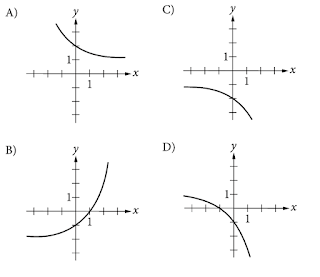
2. (Test2/Q 10/No Calculator)
Which of the following equations has a graph in the $x y$-plane for which $y$ is always greater than or equal to $-1$ ?
A) $y=|x|-2$
B) $y=x^{2}-2$
C) $y=(x-2)^{2}$
D) $y=x^{3}-2$
|
|
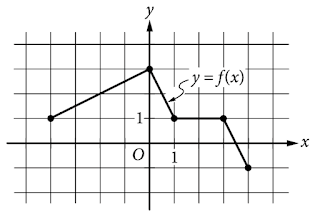
3. (Test2/Q 26/Calculator)
The complete graph of the function $f$ is shown in the $x y$-plane above. Which of the following are equal to 1 ?
I. $f(-4)$
II. $f\left(\frac{3}{2}\right)$
III. $f(3)$
A) III only
B) I and III only
C) II and III only
D) I, II, and III
|
|
4. (Test $3 / Q 1 /$ Calculator)
The graph above shows Marilyn's distance from her campsite during a 3 -hour hike. She stopped for 30 minutes during her hike to have lunch. Based on the graph, which of the following is closest to the time she finished lunch and continued her hike?
A) 12:40 P.M.
B) 1:10 P.M.
C) 1:40 P.M.
D) 2:00 P.M.
|
|
5. (Test3/Q $12 /$ Calculator)
| If the function $f$ has five distinct zeros, which of the following could represent the complete graph of $f$ in the $x y$-plane?
|
6. (Test3/Q $16 /$ Calculator)
Graphs of the functions $f$ and $g$ are shown in the $x y$-plane above. For which of the following values of $x$ does $f(x)+g(x)=0$ ?
A) $-3$
B) $-2$
C) $-1$
D) 0
|
|
7. (Test4/Q 13/No Calculator)
The functions $f$ and $g$, defined by $f(x)=8 x^{2}-2$ and $g(x)=-8 x^{2}+2$, are graphed in the $x y$-plane above. The graphs of $f$ and $g$ intersect at the points $(k, 0)$ and $(-k, 0)$. What is the value of $k$ ?
A) $\frac{1}{4}$
B) $\frac{1}{2}$
C) 1
D) 2
|
|
8. (Test $4 / \mathrm{Q} 10 /$ Calculator)
Gestation Period versus Life Expectancy
Gestation period (days)
A curator at a wildlife society created the scatterplot above to examine the relationship between the gestation period and life expectancy of 10 species of animals.
What is the life expectancy, in years, of the animal that has the longest gestation period?
|
9. (Test $4 / \mathrm{Q} 11 /$ Calculator)
Gestation Period versus Life Expectancy
A curator at a wildlife society created the scatterplot above to examine the relationship between the gestation period and life expectancy of 10 species of animals.
Of the labeled points, which represents the animal for which the ratio of life expectancy to gestation period is greatest?
A) $A$
B) $B$
C) $C$
D) $D$
|
|
10. (Test $4 / \mathrm{Q} 20 /$ Calculator)
| The mass of living organisms in a lake is defined to be the biomass of the lake. If the biomass in a lake doubles each year, which of the following graphs could model the biomass in the lake as a function of time? (Note: In each graph below, O represents $(0,0) .)$
|
11. (Test $4 / Q 30 /$ Calculator)
The function $f(x)=x^{3}-x^{2}-x-\frac{11}{4}$ is graphed in the $x y$-plane above. If $k$ is a constant such that the equation $f(x)=k$ has three real solutions, which of the following could be the value of $k$ ?
A) 2
B) 0
C) $-2$
D) $-3$
|
|
12. (Test5/Q 14/No Calculator)
| $$f(x)=2^{x}+1$$
The function $f$ is defined by the equation above. Which of the following is the graph of $y=-f(x)$ in the $x y$-plane?
|
13. (Test5/Q 20/Calculator)
The figure on the left above shows a wheel with a mark on its rim. The wheel is rolling on the ground at a constant rate along a level straight path from a starting point to an ending point. The graph of $y=d(t)$ on the right could represent which of the following as a function of time from when the wheel began to roll?
A) The speed at which the wheel is rolling
B) The distance of the wheel from its starting point
C) The distance of the mark on the rim from the center of the wheel
D) The distance of the mark on the rim from the ground
|
|
14. (Test6/Q 5/No Calculator)
| Which of the following is the graph of the equation $y=2 x-5$ in the $x y$-plane?
|
15. (Test6/Q 2/Calculator)
The graph above shows the positions of Paul and Mark during a race. Paul and Mark each ran at a constant rate, and Mark was given a head start to shorten the distance he needed to run. Paul finished the race in 6 seconds, and Mark finished the race in 10 seconds. According to the graph, Mark was given a head start of how many yards?
|
16. (Test $6 / Q 3 /$ Calculator)
| Snow fell and then stopped for a time. When the snow began to fall again, it fell at a faster rate than it had initially. Assuming that none of the snow melted during the time indicated, which of the following graphs could model the total accumulation of snow versus time?
|
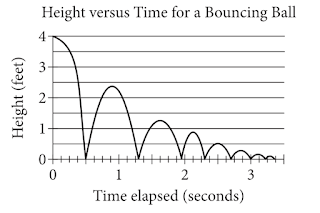
17. (Test6/Q 23/Calculator)
Height versus Time for a Bouncing Ball
As part of an experiment, a ball was dropped and allowed to bounce repeatedly off the ground until it came to rest. The graph above represents the relationship between the time elapsed after the ball was dropped and the height of the ball above the ground. After it was dropped, how many times was the ball at a height of 2 feet?
A) One
B) Two
C) Three
D) Four
|
|
18. (Test7/Q 13/Calculator)
Theresa's Running Speed and Time
Theresa ran on a treadmill for thirty minutes, and her time and speed are shown on the graph above. According to the graph, which of the following statements is NOT true concerning Theresa's run?
A) Theresa ran at a constant speed for five minutes.
B) Theresa's speed was increasing for a longer period of time than it was decreasing.
C) Theresa's speed decreased at a constant rate during the last five minutes.
D) Theresa's speed reached its maximum during the last ten minutes.
|
|
19. (Test8/Q 2/Calculator)
Tracy collects, sells, and trades figurines, and she tracks the number of figurines in her collection on the graph below.
On what interval did the number of figurines decrease the fastest?
A) Between 1 and 2 months
B) Between 2 and 3 months
C) Between 3 and 4 months
D) Between 4 and 5 months
|
|
20. (Test $8 / \mathrm{Q} 19 /$ Calculator)
| The range of the polynomial function $f$ is the set of real numbers less than or equal to 4 , If the zeros of $f$ are $-3$ and 1 , which of the following could be the graph of $y=f(x)$ in the $x y$-plane?
|
21. (Test8/Q 30/Calculator)
$$\begin{array}{|c|c|}
\hline x & g(x)\\
\hline -2&1 \\
\hline -1&2 \\
\hline 0&3 \\
\hline 1&4 \\
\hline 2&5 \\
\hline 3&6 \\
\hline 4&7 \\
\hline \end{array}$$
The complete graph of the function $f$ and a table of values for the function $g$ are shown above. The maximum value of $f$ is $k.$ What is the value of $g(k)$?
|
Answer


Casino Sites, Bonuses, and Promotions 2021
ReplyDeleteCasino win bet win Sites, Bonuses, and Promotions 2021 · 1. VBET Casino bwin - $1,000 Free 먹튀사이트먹튀랭크 · 2. William Hill - $1,000 울산 대딸 Free · 3. Unibet Casino - $1,000 Free · 4. 스보벳 Caesars Casino - $1,000
Post a Comment