$\def\frac{\dfrac}$
| 1 | (IB/sl/2019/November/Paper2/q7)
[Maximum mark: 7 ]
The following table shows the probability distribution of a discrete random variable X, where $a \geq 0$ and $b \geq 0$ $$\begin{array}{|c|c|c|c|c|}\hline x & 1 & 4 & a & a+b-0.5 \\\hline \mathrm{P}(X=x) & 0.2 & 0.5 & b & a \\\hline\end{array} $$
| (b) | Find the difference between the greatest possible expected value and the least possible expected value. |
|
| 2 | (IB/sl/2019/May/paper1tz2/ql)
[Maximum mark: 6]
The following table shows the probability distribution of a discrete random variable $X$. $$\begin{array}{|c|c|c|c|c|}\hline X & 0 & 1 & 2 & 3 \\\hline \mathrm{P}(X=x) & \frac{3}{13} & \frac{1}{13} & \frac{4}{13} & k \\\hline\end{array}$$
| (a) | Find the value of $k$. |
| (b) | Find $\mathrm{E}(X)$. [3] |
|
| 3 | (IB/sl/2019/May/paper2tz1/q1)
[Maximum mark: 5]
Ten students were asked for the distance, in $\mathrm{km}$, from their home to school. Their responses are recorded below. $\begin{array}{llllllllll}0.3 & 0.4 & 3 & 3 & 3.5 & 5 & 7 & 8 & 8 & 10\end{array}$
| (a) | For these data, find the mean distance from a student's home to school. |
The following box-and-whisker plot represents this data.
| (b) | Find the value of $p$. [1] |
| (c) | Find the interquartile range. |
|
Click to view the following problems
| 4 | (IB/s1/2019/May/paper2tz1/q10)
[Maximum mark: 16]
There are three fair six-sided dice. Each die has two green faces, two yellow faces and two red faces. All three dice are rolled.
| (a) | (i) Find the probability of rolling exactly one red face.
(ii) Find the probability of rolling two or more red faces. |
Ted plays a game using these dice. The rules are:
Having a turn means to roll all three dice.
He wins $\$ 10$ for each green face rolled and adds this to his winnings.
After a turn Ted can either
end the game (and keep his winnings), or
have another turn (and try to increase his winnings).
If two or more red faces are rolled in a turn, all winnings are lost and the game ends.
| (b) | Show that, after a turn, the probability that Ted adds exactly $\$ 10$ to his winnings is $\frac{1}{3}$. |
The random variable $D(\mathrm{~S})$ represents how much is added to his winnings after a turn.
The following table shows the distribution for $D$, where $\$ w$ represents his winnings in the game so far. $$\begin{array}{|c|c|c|c|c|c|}\hline D(\$)& -w & 0 & 10 & 20 & 30 \\\hline \mathrm{P}(D=d) & x & y & \frac{1}{3} & \frac{2}{9} & \frac{1}{27} \\\hline\end{array}$$
| (c) | (i) Write down the value of $x$.
(ii) Hence, find the value of $y$. |
Ted will always have another turn if he expects an increase to his winnings.
| (d) | Find the least value of $w$ for which Ted should end the game instead of having, another turn. |
|
| 5 | (IB/sl/2018/November/Paper1/q9)
[Maximum mark: 15]
A bag contains $n$ marbles, two of which are blue. Hayley plays a game in which she randomly draws marbles out of the bag, one after another, without replacement. The game ends when Hayley draws a blue marble.
| (a) | Find the probability, in terms of $n$, that the game will end on her,
(i) first draw;
(ii) second draw.$[4]$ |
| (b) | Let $n=5$. Find the probability that the game will end on her
(i) third draw;
(ii) fourth draw.$[4]$ |
Hayley plays the game when $n=5 .$ She pays $\$ 20$ to play and can earn money back depending on the number of draws it takes to obtain a blue marble. She earns no money back if she obtains a blue marble on her first draw. Let $M$ be the amount of money that she earns back playing the game. This information is shown in the following table,$$\begin{array}{|c|c|c|c|c|}\hline \text{Number of draws} & 1 & 2 & 3 & 4 \\\hline \text{Money earned back} \mathbf{( S} M ) & 0 & 20 & 8 k & 12 k \\\hline\end{array}$$
| (c) | Find the value of $k$ so that this is a fair game.$[7]$ |
|
| 6 | (IB/sl/2018/May/paper2tz1/q2)
[Maximum mark: 6]
A biased four-sided die is rolled. The following table gives the probability of each score. $$\begin{array}{|c|c|c|c|c|}\hline \text{Score }& 1 & 2 & 3 & 4 \\\hline \text{Probability} & 0.28& k & 0.15 & 0.3 \\\hline\end{array}$$
| (a) | Find the value of $k$. |
| (b) | Calculate the expected value of the score. |
| (c) | The die is rolled 80 times. On how many rolls would you expect to obtain a three? |
|
| 7 | $(\mathrm{IB} / \mathrm{sl} / 2017 /$ November $/$ Paper $2 / \mathrm{q} 4)$
[Maximum mark: 8]
A discrete random variable $X$ has the following probability distribution. $$\begin{array}{|c|c|c|c|c|}\hline X & 0 & 1 & 2 & 3 \\\hline \mathrm{P}(X=x) & 0.475 & 2 h^{2} & \frac{k}{10} & 6 k^{2} \\\hline\end{array}$$
| (a) | Find the value of $k$. |
| (b) | Write down $\mathrm{P}(X=2)$. [1] |
| (c) | Find $\mathrm{P}(X=2 \mid X>0$ ). [3] |
|
| 8 | (IB/s1/2017/May/paper1tz1/q10)
[Maximum mark: 15]
The following table shows the probability distribution of a discrete random variable $A$, in terms of an angle $\theta$, $$\begin{array}{|c|c|c|}\hline a & 1 & 2 \\\hline \mathrm{P}(A=a) & \cos \theta & 2 \cos 2 \theta \\\hline\end{array}$$
| (a) | Show that $\cos \theta=\frac{3}{4}$. |
| (b) | Given that $\tan \theta>0$, find $\tan \theta$. |
| (c) | Let $y=\frac{1}{\cos x}$, for $0 < x < \frac{\pi}{2}$, The graph of $y$ between $x=\theta$ and $x=\frac{\pi}{4}$ is rotated $360^{\circ}$ about the $x$-axis. Find the volume of the solid formed. |
|
| 9 | (IB/s1/2017/May/paper2tz2/q10)
[Maximum mark: 15]
The following table shows a probability distribution for the random variable $X$, where $\mathrm{E}(X)=1.2$, $$\begin{array}{|c|c|c|c|c|}\hline x & 0 & 1 & 2 & 3 \\\hline \mathrm{P}(X=x) & p & \frac{1}{2} & \frac{3}{10} & q \\\hline\end{array}$$
| (a) | (i) Find $q$.
(ii) Find $p$. |
A bag contains white and blue marbles, with at least three of each colour. Three marbles are drawn from the bag. without replacement. The number of blue marbles drawn is given by the random variable $X$.
| (b) | (i) Write down the probability of drawing three blue marbles.
(ii) Explain why the probability of drawing three white marbles is $\frac{1}{6}$.
(iii) The bag contains a total of ten marbles of which $w$ are white. Find $w$. |
A game is played in which three marbles are drawn from the bag of ten marbles, without replacement. A player wins a prize if three white marbles are drawn.
| (c) | Jill plays the game nine times. Find the probability that she wins exactly two prizes. |
| (d) | Grant plays the game until he wins two prizes. Find the probability that he wins his second prize on his eighth attempt. |
|
| 10 | (IB/s1/2016/May/paper2tz1/q8)
[Maximum mark: 15]
A factory has two machines, $A$ and $B$. The number of breakdowns of each machine is independent from day to day.
Let $A$ be the number of breakdowns of Machine A on any given day. The probability distribution for $A$ can be modelled by the following table. $$\begin{array}{|c|l|l|l|l|}\hline a & 0 & 1 & 2 & 3 \\\hline \mathrm{P}(A=a) & 0.55 & 0.3 & 0.1& k$\\\hline\end{array}$$
| (b) | (i) A day is chosen at random. Write down the probability that Machine A has? no breakdowns.
(ii) Five days are chosen at random. Find the probability that Machine $\mathrm{A}$ has no breakdowns on exactly four of these days. |
Let $B$ be the number of breakdowns of Machine $\mathrm{B}$ on any given day. The probability distribution for $B$ can be modelled by the following table.$$\begin{array}{|c|l|l|l|l|}\hline b & 0 & 1 & 2 & 3 \\\hline \mathrm{P}(B=b) & 0.7 & 0.2 & 0.08 & 0.02 \\\hline\end{array}$$
| (c) | Find $\mathrm{E}(B)$. |
On Tuesday, the factory uses both Machine $\mathrm{A}$ and Machine $\mathrm{B}$. The variables $A$ and $B$ are independent.
| (d) | (i) Find the probability that there are exactly two breakdowns on Tuesday.
(ii) Given that there are exactly two breakdowns on Tuesday, find the probability that both breakdowns are of Machine $\mathrm{A}$. |
|
| 11 | (IB/s1/2019/November/Paper1/q7)
[Maximum mark: 6]
Let $X$ and $Y$ be normally distributed with $X \sim \mathrm{N}\left(14, a^{2}\right)$ and $Y \sim \mathrm{N}\left(22, a^{2}\right), a>0$.
| (a) | Find $b$ so that $\mathrm{P}(X>b)=\mathrm{P}(Y < b)$. |
It is given that $\mathrm{P}(X>20)=0.112$.
| (b) | Find $\mathrm{P}(16 < Y < 28)$. |
|
| 12 | (IB/s1/2019/November/Paper2/q9)
[Maximum mark: 15]
SpeedWay airline flies from city $\mathrm{A}$ to city $\mathrm{B}$. The flight time is normally distributed with a mean of 260 minutes and a standard deviation of 15 minutes. A flight is considered late if it takes longer than 275 minutes.
| (a) | Calculate the probability a flight is not late. |
The flight is considered to be on time if it takes between $m$ and 275 minutes, The probability that a flight is on time is $0.830$.
| (b) | Find the value of $m$. |
During a week, SpeedWay has 12 flights from city A to city B. The time taken for any flight is independent of the time taken by any other flight.
| (c) | (i) Calculate the probability that at least 7 of these flights are on time.
(ii) Given that at least 7 of these flights are on time, find the probability that exactly 10 flights are on time. |
SpeedWay increases the number of flights from city A to city B to 20 flights each week, and improves their efficiency so that more flights are on time. The probability that at least 19 flights are on time is $0.788$.
| (d) | A flight is chosen at random. Calculate the probability that it is on time. |
|
| 13 | (IB/s1/2019/May/paper1tz1/q9)
[Maximum mark: 13]
A random variable $Z$ is normally distributed with mean 0 and standard deviation 1 . It is known that $\mathrm{P}(z < -1.6)=a$ and $\mathrm{P}(z>2.4)=b$. This is shown in the following diagram.
| (a) | Find $\mathrm{P}(-1.6 < z < 2.4)$. Write your answer in terms of $a$ and $b$. |
| (b) | Given that $z>-1.6$, find the probability that $z < 2.4$. Write your answer in terms of $a$ and $b$ |
A second random variable $X$ is normally distributed with mean $m$ and standard deviation $s$.
It is known that $\mathrm{P}(x < 1)=a$.
| (c) | Write down the standardized value for $x=1$. |
It is also known that $\mathrm{P}(x>2)=b$.
|
| 14 | (IB/s1/2019/May/paper2tz2/q9)
[Maximum mark: 14]
At Penna Airport the probability, $\mathrm{P}(A)$, that all passengers arrive on time for a flight is $0.70$, The probability, $\mathrm{P}(D)$, that a flight departs on time is $0.85$. The probability that all passengers arrive on time for a fight and it departs on time is $0.65$.
| (a) | Show that event $A$ and event $D$ are not independent. |
| (b) | (i) Find $\mathrm{P}(A \cap D)$.
(ii) Given that all passengers for a flight arrive on time, find the probability that the flight does not depart on time. |
The number of hours that pilots fly per week is normally distributed with a mean of 25 hours and a standard deviation $\sigma .90 \%$ of pilots fly less than 28 hours in a week.
| (c) | Find the value of $\sigma$. |
| (d)) | (d) All flights have two pilots. Find the percentage of flights where both pilots flew more than 30 hours last week. |
|
| 15 | (IB/s1/2018/November/Paper2/q9)
[Maximum mark: 15]
A nationwide study on reaction time is conducted on participants in two age groups. The participants in Group $X$ are less than 40 years old. Their reaction times are normally distributed with mean $0.489$ seconds and standard deviation $0.07$ seconds.
| (a) | A person is selected at random from Group $X$. Find the probability that their reaction time is greater than $0.65$ seconds. |
The participants in Group $Y$ are 40 years or older. Their reaction times are normally distributed with mean $0.592$ seconds and standard deviation $\sigma$ seconds.
| (b) | The probability that the reaction time of a person in Group $Y$ is greater than $0.65$ seconds is $0.396$. Find the value of $\sigma$. |
In the study, $38 \%$ of the participants are in Group $X$.
| (c) | A randomly selected participant has a reaction time greater than $0.65$ seconds. |
Find the probability that the participant is in Group $\mathrm{X}$.
| (d) | Ten of the participants with reaction times greater than $0.65$ are selected at random. |
Find the probability that at least two of them are in Group $X$.
|
| 16 | (IB/s1/2018/May/paper2tz1/q9)
[Maximum mark: 17]
The weights, in grams, of oranges grown in an orchard, are normally distributed with a mean of $297 \mathrm{~g}$. It is known that $79 \%$ of the oranges weigh more than $289 \mathrm{~g}$ and $9.5 \%$ of the oranges weigh more than $310 \mathrm{~g}$.
| (a) | Find the probability that an orange weighs between $289 \mathrm{~g}$ and $310 \mathrm{~g}$. |
The weights of the oranges have a standard deviation of $\sigma$,
| (b) | (i) Find the standardized value for $289 \mathrm{~g}$.
(ii) Hence, find the value of $\sigma$. |
The grocer at a local grocery store will buy the oranges whose weights exceed the 35 th percentile.
| (c) | To the nearest gram, find the minimum weight of an orange that the grocer will buy. |
The orchard packs oranges in boxes of 36 .
| (d) | Find the probability that the grocer buys more than half the oranges in a box selected at random. |
The grocer selects two boxes at random.
| (e) | Find the probability that the grocer buys more than half the oranges in each box. |
|
| 17 | (IB/s1/2018/May/paper2tz2/q10)
[Maximum mark: 17]
The mass $M$ of apples in grams is normally distributed with mean $\mu$. The following table shows probabilities for values of $M$. $$\begin{array}{|c|c|c|c|}\hline Values of M & M < 93 & 93 \leq M \leq 119 & M> 119 \\\hline \mathbf{P}(\boldsymbol{X}) & k & 0.98 & 0.01 \\\hline\end{array}$$
| (a) | (i) Write down the value of $k$.
(ii) Show that $\mu=106$. |
| (b) | Find $\mathrm{P}(M < 95)$. |
The apples are packed in bags of ten. Any apples with a mass less than $95 \mathrm{~g}$ are classified as small.
| (c) | Find the probability that a bag of apples selected at random contains at most one small apple. |
| (d) | A crate contains 50 bags of apples. A crate is selected at random.
(i) Find the expected number of bags in this crate that contain at most one small apple.
(ii) Find the probability that at least 48 bags in this crate contain at most one small apple. |
|
| 18 | (IB/s1/2017/November/Paper2/q7)
[Maximum mark: 7]
The heights of adult males in a country are normally distributed with a mean of $180 \mathrm{~cm}$ and a standard deviation of $\sigma \mathrm{cm} .17 \%$ of these men are shorter than $168 \mathrm{~cm} .80 \%$ of them have heights between $(192-h) \mathrm{cm}$ and $192 \mathrm{~cm}$. Find the value of $h$.
|
| 19 | (IB/s1/2017/May/paper1tz2/q3)
[Maximum mark: 6]
The random variable $X$ is normally distributed with a mean of 100 . The following diagram shows the normal curve for $X$.
Let $R$ be the shaded region under the curve, to the right of 107 . The area of $R$ is $0.24$.
| (a) | Write down $\mathrm{P}(X>107)$ |
| (b) | Find $\mathrm{P}(100 < X < 107)$. [3] |
| (c) | Find $\mathrm{P}(93 < X < 107)$. |
|
| 20 | (IB/s1/2017/May/paper2tz1/q9)
[Maximum mark: 15]
A random variable $X$ is normally distributed with mean, $\mu$. In the following diagram, the shaded region between 9 and $\mu$ represents $30 \%$ of the distribution.
The standard deviation of $X$ is $2.1$.
| (b) | Find the value of $\mu$. |
The random variable $Y$ is normally distributed with mean $\lambda$ and standard deviation $3.5$, The events $X>9$ and $Y>9$ are independent, and $P((X>9) \cap(Y>9))=0.4$.
| (d) | Given that $Y>9$, find $P(Y < 13)$. |
|
| 21 | (IB/s1/2016/May/paper2tz1/q1)
[Maximum mark: 6]
A random variable $X$ is distributed normally with a mean of 20 and standard deviation of 4 .
| (a) | On the following diagram, shade the region representing $\mathrm{P}(X \leq 25$ ). |
| (b) | Write down $\mathrm{P}(X \leq 25$ ), correct to two decimal places. |
| (c) | Let $\mathrm{P}(X \leq c)=0.7$, Write down the value of $c$. [2] |
|
| 22 | (IB/s1/2016/May/paper2tz2/q6)
[Maximum mark: 6]
A competition consists of two independent events, shooting at 100 targets and running for one hour. The number of targets a contestant hits is the $S$ score. The $S$ scores are normally distributed with mean 65 and standard deviation 10 .
| (a) | A contestant is chosen at random. Find the probability that their $S$ score is less than 50 . |
The distance in $\mathrm{km}$ that a contestant runs in one hour is the $R$ score. The $R$ scores are normally distributed with mean 12 and standard deviation $2.5$. The $R$ score is independent of the $S$ score.
Contestants are disqualified if their $S$ score is less than 50 and their $R$ score is less than $x \mathrm{~km}$.
| (b) | Given that $1 \%$ of the contestants are disqualified, find the value of $x$. $[4]$ |
|
| 23 | (IB/sl/2019/May/paper1tz1/q1)
[Maximum mark: 6]
The following Venn diagram shows the events $A$ and $B$, where $\mathrm{P}(A)=0.3$. The values shown are probabilities.
| (a) | Find the value of $p$. [2] |
| (b) | Find the value of $q$. [2] |
| (c) | Find $\mathrm{P}\left(A^{\prime} \cup B\right)$. [2] |
|
| 24 | (IB/s1/2018/May/paper2tz1/q5)
[Maximum mark: 6]
Two events $A$ and $B$ are such that $\mathrm{P}(A)=0.62$ and $\mathrm{P}(A \cap B)=0.18$.
| (a) | Find $\mathrm{P}\left(A \cap B^{\prime}\right)$. |
| (b) | Given that $\mathrm{P}\left((A \cup B)^{\prime}\right)=0.19$, find $\mathrm{P}\left(A \mid B^{\prime}\right)$. |
|
| 25 | (IB/s1/2016/November/Paper1/q5)
[Maximum mark: 6]
Events $A$ and $B$ are independent with $\mathrm{P}(A \cap B)=0.2$ and $\mathrm{P}\left(A^{\prime} \cap B\right)=0.6$.
| (a) | Find $\mathrm{P}(B)$.[2] |
| (b) | Find $\mathrm{P}(A \cup B)$.$[4]$ |
|
| 26 | (IB/sl/2018/May/paper1tz2/q8)
[Maximum mark: 14]
Pablo drives to work. The probability that he leaves home before $07: 00$ is $\frac{3}{4}$. If he leaves home before $07: 00$ the probability he will be late for work is $\frac{1}{8}$. If he leaves home at $07: 00$ or later the probability he will be late for work is $\frac{5}{8}$.
| (a) | Copy and complete the following tree diagram. |
| (b) | Find the probability that Pablo leaves home before 07:00 and is late for work. |
| (c) | Find the probability that Pablo is late for work. |
| (d) | Given that Pablo is late for work, find the probability that he left home before $07: 00$. |
| (e) | Two days next week Pablo will drive to work. Find the probability that he will be late at least once, |
|
| 27 | (IB/sl/2017/November/Paper1/q1)
[Maximum mark: 6]
A bag contains 5 green balls and 3 white balls. Two balls are selected at random without replacement.
| (a) | Complete the following tree diagram.
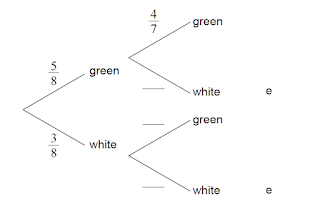 |
| (b) | Find the probability that exactly one of the selected balls is green. [3] |
|
| 28 | (IB/s1/2017/May/paper2tz1/g4)
[Maximum mark: 6]
In a large university the probability that a student is left handed is $0.08$. A sample of 150 students is randomly selected from the university. Let $k$ be the expected number of left-handed students in this sample.
| (b) | Hence, find the probability that
(i) exactly $k$ students are left handed;
(ii) fewer than $k$ students are left handed. |
|
| 29 | (IB/s1/2016/November/Paper2/q5)
[Maximum mark: 6]
The weights, $W$, of newborn babies in Australia are normally distributed with a mean $3.41 \mathrm{~kg}$ and standard deviation $0.57 \mathrm{~kg}$. A newborn baby has a low birth weight if it weighs less than $w \mathrm{~kg}$.
| (a) | Given that $5.3 \%$ of newborn babies have a low birth weight, find $w$. |
| (b) | A newborn baby has a low birth weight. |
Find the probability that the baby weighs at least $2.15 \mathrm{~kg}$.
|
| 30 | (IB/sl/2016/November/Paper2/q7)
[Maximum mark; 6]
A jar contains 5 red discs, 10 blue discs and $m$ green discs. A disc is selected at random and replaced. This process is performed four times.
| (a) | Write down the probability that the first disc selected is red. |
| (b) | Let $X$ be the number of red discs selected. Find the smallest value of $m$ for which $\operatorname{Var}(X) < 0.6$. |
|
| 31 | (IB/s1/2016/May/paper1tz1/q2)
[Maximum mark: 6]
The following Venn diagram shows the events $A$ and $B$, where $\mathrm{P}(A)=0.4, \mathrm{P}(A \cup B)=0.8$ and $P(A \cap B)=0,1$. The values $p$ and $q$ are probabilities.
| (a) | (i) Write down the value of $q$.
(ii) Find the value of $p$. [3] |
| (b) | Find $\mathrm{P}(B)$. $[3]$ |
|
| 32 | (IB/s1/2016/May/paper1tz2/q8)
[Maximum mark: 13]
In a class of 21 students, 12 own a laptop, 10 own a tablet, and 3 own neither. The following Venn diagram shows the events "own a laptop" and "own a tablet". The values $p, q, r$ and $s$ represent numbers of students.
| (a) | (i) Write down the value of $p$.
(ii) Find the value of $q$.
(iii) Write down the value of $r$ and of $s$. |
| (b) | A student is selected at random from the class.
(i) Write down the probability that this student owns a laptop.
(ii) Find the probability that this student owns a laptop or a tablet but not both. |
| (c) | Two students are randomly selected from the class. Let $L$ be the event a "student, owns a laptop",
(i) Copy and complete the following tree diagram. (Do not write on this page.)
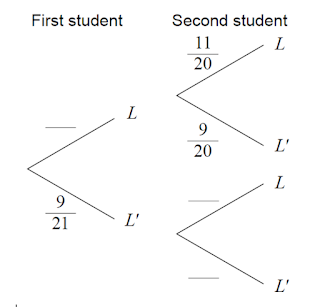
(ii) Write down the probability that the second student owns a laptop given that the first owns a laptop. |
|
| 33 | (IB/s1/2019/May/paper1tz2/q8)
[Maximum mark: 16]
A group of 10 girls recorded the number of hours they spent watching television during a particular week. Their results are summarized in the box-and-whisker plot below.
| (a) | The range of the data is 16 . Find the value of $a$. [2] |
| (b) | Find the value of the interquartile range. [2] |
The group of girls watched a total of 180 hours of television.
| (c) | Find the mean number of hours that the girls in this group spent watching television that week. |
A group of 20 boys also recorded the number of hours they spent watching television that same week. Their results are summarized in the table below. $$\begin{array}{|l|l|}\hline \bar{x}=21 & \sigma=3\\\hline\end{array}$$
| (d) | (i) Find the total number of hours the group of boys spent watching television that week.
(ii) Find the mean number of hours that all 30 girs and boys spent watching television that week. |
The following week, the group of boys had exams. During this exam week, the boys spent half as much time watching television compared to the previous week.
| (e) | For this exam week, find
(i) the mean number of hours that the group of boys spent watching television;
(ii) the variance in the number of hours the group of boys spent watching television. |
|
| 34 | (IB/s1/2018/May/paper1tz1/q2)
[Maximum mark: 6]
The following box-and-whisker plot shows the number of text messages sent by students in a school on a particular day.
| (a) | Find the value of the interquartile range. |
| (b) | One student sent $k$ text messages, where $k>11$. Given that $k$ is an outlier, find the least value of $k$. |
|
| 35 | (IB/sl/2018/May/paper1tz2/q3)
[Maximum mark: 6]
A data set has $n$ items. The sum of the items is 800 and the mean is 20 .
The standard deviation of this data set is 3 . Each value in the set is multiplied by 10 .
| (b) | (i) Write down the value of the new mean.
(ii) Find the value of the new variance. $[4]$ |
|
| 36 | (IB/s1/2017/May/paper1tz2/q8)
[Maximum mark: 14]
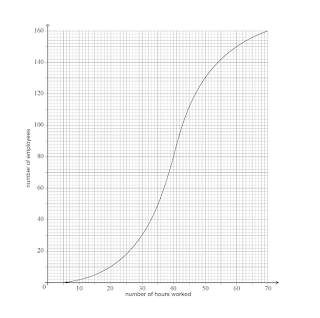
A city hired 160 employees to work at a festival. The following cumulative frequency curve shows the number of hours employees worked during the festival.
| (a) | (i) Find the median number of hours worked by the employees.
(ii) Write down the number of employees who worked 50 hours or less.
|
The city paid each of the employees $£ 8$ per hour for the first 40 hours worked, and $£ 10$ per hour for each hour they worked after the first 40 hours.
| (b) | Find the amount of money an employee earned for working
(i) 40 hours;
(ii) 43 hours. $[4]$ |
| (c) | Find the number of employees who earned $£ 200$ or less. |
| (d) | Only 10 employees earned more than $£ k$. Find the value of $k$. $[4]$ |
|
| 37 | (IB/s1/2017/May/paper2tz1/q1)
[Maximum mark: 7]
Consider the following frequency table.$$\begin{array}{|c|c|}\hline x & \text{Frequency} \\\hline 2 & 8 \\\hline 4 & 15 \\\hline 7 & 21 \\\hline 10 & 28 \\\hline 11 & 3 \\\hline\end{array}$$
| (a) | (i) Write down the mode.
(ii) Find the value of the range. |
| (b) | (i) Find the mean.
(ii) Find the variance. |
|
| 38 | (IB/sl/2016/November/Paper2/q8)
[Maximum mark: 16]
Ten students were surveyed about the number of hours, $x$, they spent browsing the Internet during week 1 of the school year. The resuits of the survey are given below. $$\sum_{i=1}^{10} x_{i}=252, \sigma=5 \text { and median }=27$$
| (a) | Find the mean number of hours spent browsing the Internet. |
| (b) | During week 2, the students worked on a major project and they each spent an additional five hours browsing the Internet. For week 2, write down
(i) the mean;
(ii) the standard deviation. |
| (c) | During week 3 each student spent $5 \%$ less time browsing the internet than during week 1. For week 3, find
(i) the median;
(ii) the variance. |
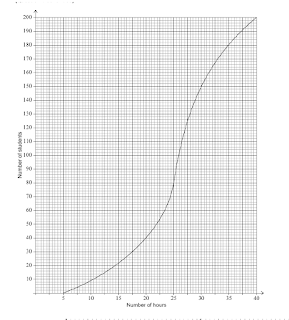
| (d) | During week 4, the survey was extended to all 200 students in the school. The results are shown in the cumulative frequency graph on the following page.
(i) Find the number of students who spent between 25 and 30 hours browsing the Internet.
(ii) Given that $10 \%$ of the students spent more than $k$ hours browsing the internet, find the maximum value of $k$. |
|
| 39 | Question (IB/sl/2016/November/Paper2/q8b) 38 continued
|
| 40 | (IB/sl/2016/May/paper1tz1/q8)
[Maximum mark: 15]
A school collects cans for recycling to raise money. Sam's class has 20 students.
The number of cans collected by each student in Sam's class is shown in the following stem and leaf diagram. $$\begin{array}{r|l} \text{Stem }& \text{Leaf }\\\hline 2 & 0,1,4,9,9 \\3 & 1,7,7,7,8,8 \\4 & 1,2,2,3,5,6,7,8 \\5 & 0\end{array}$$
Key: $3 \mid 1$ represents 31 cans
| (a) | Find the median number of cans collected. [2] |
The following box-and-whisker plot also displays the number of cans collected by students in Sam's class.
| (b) | (i) Write down the value of $a$.
(ii) The interquartile range is 14 . Find the value of $b$. |
| (c) | Sam's class collected 745 cans. They want an average of 40 cans per student. How many more cans need to be collected to achieve this target? |
There are 80 students in the school.
| (d) | The students raise $\$ 0.10$ for each recycled can.
(i) Find the largest amount raised by a student in Sam's class.
(ii) The following cumulative frequency curve shows the amounts in dollars raised by all the students in the school. Find the percentage of students in the school who raised more money than anyone in Sam's class. [5] |
|
| 41 | Question (IB/sl/2016/May/paper1tz1/q8b) 40 continued
| (e) | The mean number of cans collected is $39.4$. The standard deviation is $18.5$. Each student then collects 2 more cans.
(i) Write down the new mean.
(ii) Write down the new standard deviation. |
|
| 42 | (IB/s1/2016/May/paper1tz2/q2)
[Maximum mark: 5]
There are 10 items in a data set. The sum of the items is 60 .
The variance of this data set is $3 .$ Each value in the set is multiplied by 4 .
| (b) | (i) Write down the value of the new mean.
(ii) Find the value of the new variance. [3] |
|
| 43 | (IB/sl/2015/November/Paper2/q2)
[Maximum mark: 5]
The following table shows the probability distribution of a discrete random variable $X$.
$$\begin{array}{|c|c|c|c|c|}\hline x & 0 & 1 & 2 & 3 \\ \hline \mathrm{P}(X=x) & 0.15 & k & 0.1 & 2 k \\ \hline\end{array}$$
| (a) | Find the value of $k$.[3] |
| (b) | Find $\mathrm{E}(X)$.[2] |
|
| 44 | (IB/s1/2015/November/Paper2/q5)
[Maximum mark: 7]
Let $C$ and $D$ be independent events, with $\mathrm{P}(C)=2 k$ and $\mathrm{P}(D)=3 k^{2}$, where $ 0 < k < 0.5$.
| (a) | Write down an expression for $\mathrm{P}(C \cap D)$ in terms of $k$. |
| (b) | Given that $\mathrm{P}(C \cap D)=0.162$, find $k$.[2] |
| (c) | Find $\mathrm{P}(C \mid D)$.[3] |
|
| 45 | (IB/s1/2015/May/paper1tz1/q1)
[Maximum mark: 6]
A discrete random variable $X$ has the following probability distribution.
$$\begin{array}{|c|c|c|c|c|}\hline x & 0 & 1 & 2 & 3 \\ \hline P(X=x) & \frac{3}{10} & \frac{4}{10} & \frac{2}{10} & p \\ \hline\end{array}$$
| (b) | Find $\mathrm{E}(X)$. $[3]$ |
|
| 46 | $\langle\mathrm{IB} / \mathrm{sl} / 2015 /$ May $/$ paper $1 \mathrm{tz} 1 / \mathrm{q} 10)$
[Maximum mark: 15]
Ann and Bob play a game where they each have an eight-sided die. Ann's die has three green faces and five red faces; Bob's die has four green faces and four red faces. They take turns rolling their own die and note what colour faces up. The first player to roll green wins,
Ann rolls first. Part of a tree diagram of the game is shown below.
| (a) | Find the probability that Ann wins on her first roll. [2] |
| (b) | (i) The probability that Ann wins on her third roll is $\frac{5}{8} \times \frac{4}{8} \times p \times q \times \frac{3}{8}$.
Write down the value of $p$ and of $q$.
(ii) The probability that Ann wins on her tenth roll is $\frac{3}{8} r^{k}$ where $r \in \mathbb{Q}, k \in \mathbb{Z}$. |
Find the value of $r$ and of $k$.
| (c) | Find the probability that Ann wins the game. $[7]$ |
|
| 47 | (IB/s1/2015/May/paper1tz2/q1)
[Maximum mark: 6]
A bag contains eight marbles. Three marbles are red and five are blue. Two marbles are drawn from the bag without replacement.
| (a) | Write down the probability that the first marble drawn is red. [1] |
| (b) | Complete the following tree diagram. $[3]$ |
| (c) | Find the probability that both marbles are blue. [2] |
|
| 48 | (IB/s1/2015/May/paper1tz2/q7)
[Maximum mark: 7]
A bag contains black and white chips. Rose pays $\$ 10$ to play a game where she draws a chip from the bag. The following table gives the probability of choosing each colour chip.
$$\begin{array}{|l|c|c|}\hline \text{Outcome} & \text{black} & \text{white }\\\hline \text{Probability} & 0.4 & 0.6 \\\hline\end{array}$$
Rose gets no money if she draws a white chip, and gets $S k$ if she draws a black chip. The game is fair. Find the value of $k$.
|
| 49 | (IB/s1/2015/May/paper2tz1/q9)
[Maximum mark: 16]
A company makes containers of yogurt. The volume of yogurt in the containers is normally distributed with a mean of $260 \mathrm{ml}$ and standard deviation of $6 \mathrm{ml}$.
A container which contains less than $250 \mathrm{ml}$ of yogurt is underfilled.
| (a) | A container is chosen at random. Find the probability that it is underfilled. |
The company decides that the probability of a container being underfilled should be reduced to $0.02$. It decreases the standard deviation to $\sigma$ and leaves the mean unchanged.
The company changes to the new standard deviation, $\sigma$, and leaves the mean unchanged. A container is chosen at random for inspection. It passes inspection if its volume of yogurt is between 250 and $271 \mathrm{ml}$.
| (c) | (i) Find the probability that it passes inspection.
(ii) Given that the container is not underfilled, find the probability that it passes inspection. |
| (d) | A sample of 50 containers is chosen at random. Find the probability that 48 or more of the containers pass inspection. |
|
| 50 | (IB/s1/2015/May/paper2tz2/q9)
[Maximum mark: 16]
A machine manufactures a large number of nails. The length, $L \mathrm{~mm}$, of a nail is normally distributed, where $L-\mathrm{N}\left(50, \sigma^{2}\right)$.
| (a) | Find $\mathrm{P}(50-\sigma < L < 50+2 \sigma)$. |
| (b) | The probability that the length of a nail is less than $53.92 \mathrm{~mm}$ is $0.975$. |
Show that $\sigma-2.00$ (correct to three significant figures).
All nails with length at least $t \mathrm{~mm}$ are classified as large nails.
| (c) | A nail is chosen at random. The probability that it is a large nail is $0.75$. Find the value of $I$. |
| (d) | (i) A nail is chosen at random from the large nails. Find the probability that the length of this nail is less than $50.1 \mathrm{~mm}$.
(ii) Ten nalls are chosen at random from the large nails. Find the probability that at least two nails have a length that is less than $50.1 \mathrm{~mm}$, |
|
| 51 | (IB/s1/2015/November/Paper1/q1)
[Maximum mark: 5]
The following box-and-whisker plot represents the examination scores of a group of students.
| (a) | Write down the median score. $[1]$ |
The range of the scores is 47 marks, and the interquartile range is 22 marks.
| (b) | Find the value of
(i) $c_{i}$
(ii) $d$. |
|
| 52 | (IB/s1/2015/November/Paper2/q10)
[Maximum mark: 14]
The masses of watermelons grown on a farm are normally distributed with a mean of $10 \mathrm{~kg}$. The watermelons are classified as small, medium or large.
A watermelon is $s m a l l$ if its mass is less than $4 \mathrm{~kg}$. Five percent of the watermelons are classified as small.
| (a) | Find the standard deviation of the masses of the watermelons. |
The following table shows the percentages of small, medium and large watermelons grown on the farm.
$$\begin{array}{|c|c|c|}\hline \text{small} & \text{medium} & \text{large }\\\hline 5 \% & 57 \% & 38 \% \\\hline\end{array}$$
A watermelon is large if its mass is greater than $w \mathrm{~kg}$.
| (b) | Find the value of $w$. |
All the medium and large watermelons are delivered to a grocer.
| (c) | The grocer selects a watermelon at random from this delivery. Find the probability that it is medium. |
The grocer sells all the medium watermelons for $\$ 1.75$ each, and all the large watermelons for $\$ 3.00$ each. His costs on this delivery are $\$ 300$, and his total profit is, $\$ 150$. Find the number of watermelons in the delivery. |
| 53 | (IB/s1/2015/May/paper1tz2/q3)
[Maximum mark: 6]
The following cumulative frequency diagram shows the lengths of 160 fish, in $\mathrm{cm}$.
| (a) | Find the median length. [2] |
The following frequency table also gives the lengths of the 160 fish.
$$\begin{array}{|l|c|c|c|c|}\hline \text{Length }x \mathrm{~cm} & 0 \leq x \leq 2 & 2 < x \leq 3 & 3 < x \leq 4.5 & 4.5 < x \leq 6 \\\hline \text{Frequency} & p & 50 & q & 20 \\\hline\end{array}$$
| (b) | (i) Write down the value of $p$.
(ii) Find the value of $q$. $[4]$ |
|
Answer
1(a) Show (b) .0625
2(a) $k=\frac{5}{13}$ (b) $\dfrac{24}{13}$
3(a) 4.82 (b) 4.25 (c) 5
40(a)(i) $\frac 49$ (ii) $\frac{7}{27}$ (b) $\frac 13$ (c)(i)$\frac{7}{27}$ (ii) $\frac{4}{27}$ (d) 40
5(a)(i) $\frac{2}{n}$ (ii) $\frac{2(n-2)}{n(n-1)}$ (b) (i) $\frac{1}{5}$ (ii) $\frac{1}{10}$ (c) $k=5$
6 (a) $k=0.27$ (b) $E(x)=2.47$ (c) 12
7(a) $k=0.25$ (b) $P(x=2)=0.025$ (c) $P(x=2 \mid x>0)=\frac{1}{21}$
8 (a) Show (b) $\tan \theta=\frac{\sqrt{7}}{3}$ (c) $V=\pi-\frac{\pi \sqrt{7}}{3}$
9(a)(i) $q=\frac{1}{30}$ (ii) $p=\frac{1}{6}$ (b) (i) $\frac{1}{30}$ (ii) $\frac{1}{6}$ (iii) $w=6$ (c) $0.279$ (d) $0.0651$
10 (a) $k=0.05$ (b) (i) $0.55$ (ii) $0.206$ (c) $0.42$ (d) (i) $0.174$ (ii) $0.402$
11(a) 18 (b) 0.776
12(a) .841 (b) 226 (c)(i) .991 (ii) .299 (d) .957
13(a) $1-a-b$ (b) $\frac{1-a-b}{1-a}$ (c) $-1.6$ (d) $\frac{1}{4}$
14(a) Show (b) (i) $0.05$ (ii) $\frac{1}{14}$ (c) $\sigma=2.34$ (d) $0.0267 \%$
15(a) $0.0107$ (b) $\sigma=0.220$ (c) $0.0163270$ (d) $0.0110$
16(a) $\quad P(289<w<310)=0.695$ (b) (i) $z=-0.806$ (ii) $\sigma=9.92$ (c) 294 (d) $P(x>18)=0.954$ (e) $0.911$
17(a)(i) $\quad k=0.01$ (ii) $\mu=106$ (b) $P(x<95)=0.0245$ (c). 976 (d) (i) $48.8$ (ii) $0.885$
18 $ h=35.7$
19(a) $P(x>107)=0.24$ (b) $P(100<x<107)=0.26$ (c) $P(93<x<107)=0.52$
20(a) $P(x<9)=0.2$ (b) $\mu=10.8$ (c) $P(x>9)=0.8$ (d) $0.747$
21(a) Graph (b) $P(x \leqslant 25)=0.89$ (c) $c=22.1$
22 (a) $P(s<50)=0.0668$ (b) $x=9.41$
23(a) 0.2 (b) 0.3 (c) 0.9
24 (a) $P\left(A \cap B^{\prime}\right)=0.44$ (b) $P\left(A \mid B^{\prime}\right)=\frac{44}{63}$
25 (a) $0.8$ (b) $0.85$
26(a) $\frac{1}{8}, \frac{7}{8} ; \frac{1}{4}$ (b) $\frac{3}{32}$ (c) $\frac{1}{4}$ (d) $\frac{3}{8}$ (e) $\frac{7}{16}$
27(a) $\frac{3}{7}, \frac{5}{7}, \frac{2}{7}$ (b) $\frac{15}{28}$
28 (a) $k=12$ (b) (i) $0.119$ (11) $P(X<12)=0.457$
29 (a) $w=2.49$ (b) $0.745$
30 (a) $P($ red $)=\frac{5}{15+m}$ (b) $m=13$
31(a)(i) $\quad q=0.1$ (ii) $p=0.3$ (b) $\quad P(B)=0.5$
32(a)(i) $\quad p=3$ (ii) $r=8, s=6$ (b) (i) $\frac{4}{7}$ (ii) $\frac{2}{3}$ (c) (i) $\left[\right.$ First: $\left.\frac{4}{7}\right],\left[\right.$ Second: $\left.\frac{3}{5}, \frac{2}{5}\right]$ (ii) $\frac{11}{20}$
33(a) 24 (b) 5 (c) 18 (d) (i) 420 (ii) 20 (e)(i) 10.5 (ii) 2.25
34(a) $7$ (b) $k=22$
35 (a) $n=40$ (b) (i) 200 (ii) 900
36(a)(i) $40$ (ii) 130 (b) (i) 320 (ii) 350 (c) 18 (d) $k=520$
37(a)(i) $10$ (ii) 9 (b)(i) $7.15$ (ii) $\sigma^{2}=8.45$
38(a) $25.2$ (b) (i) $30.2$ (ii) $\sigma=5$ (c) (i) $25.7$ (ii) $22.6$ (d)(i) $70$ (ii) $k=35$
39
40(a) 38 (b) (i) $a=20$ (ii) $b=44$ (c) 55 (d) (i) 5 (ii) $20 \%$
41(e) (i) $41.4$ (ii) $18.5$
42(a) $6$ (b) (i) 24 (ii) 48
43(a) $k=0.25$ (b) $E(x)=1.95$
44(a) $\quad 6 k^{3}$ (b) $k=0.3$ (c) $0.4$
45(a) $\quad p=\frac{1}{10}$ (b) $\mathrm{E}(x)=\frac{11}{10}$
46(a) $\frac{3}{8}$ (b) (i) $p=\frac{4}{8}, q=\frac{5}{8}$ (or) $p=\frac{5}{8}, q=\frac{4}{8}$ (ii) $r=\frac{5}{16}, k=9$ (c) $\frac{6}{11}$
47(a) $\frac{3}{8}$ (b) $\frac{2}{7}, \frac{5}{7}, \frac{3}{7}$ (c) $\frac{5}{14}$
48 $k=25$
49(a) $0.0478$ (b) $\sigma=4.87$ (c) (i) $0.968$ (ii) $0.988$ (d) $0.786$
50(a) $0.819$ (b) $\sigma=200$ (c) $t=48.7$ (d) (i) $0.360$ (ii) $0.924$
51(a) $60$ (b) (i) $c=87$ (iii) $d=52$
52(a) $\sigma=3.65$ (b) $w=11,1$ (c) $\frac{57}{95}$ (d) 200
53(a) 3 (b)(i) $p=30$ (ii) $q=60$


Post a Comment